LASR Survey 2025
Insights from Questionnaires and Interviews in the LASR Community

About the Data

Results
Industries
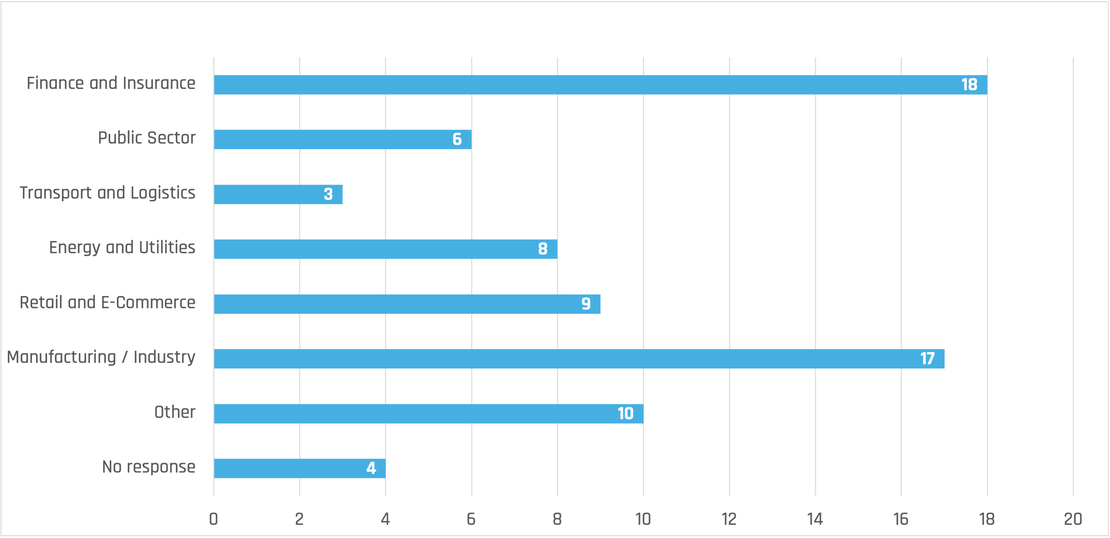
In which industry is the software system under review used?
For the industry classification, several options were provided in the online survey, with the possibility to select ‘Other’ or skip the question. This applied to all questions — none were mandatory — which results in ‘No response’ entries in the results diagrams. Anyhow, the chart highlights the broad cross-industry adoption of LASR in software development.
System Maturity
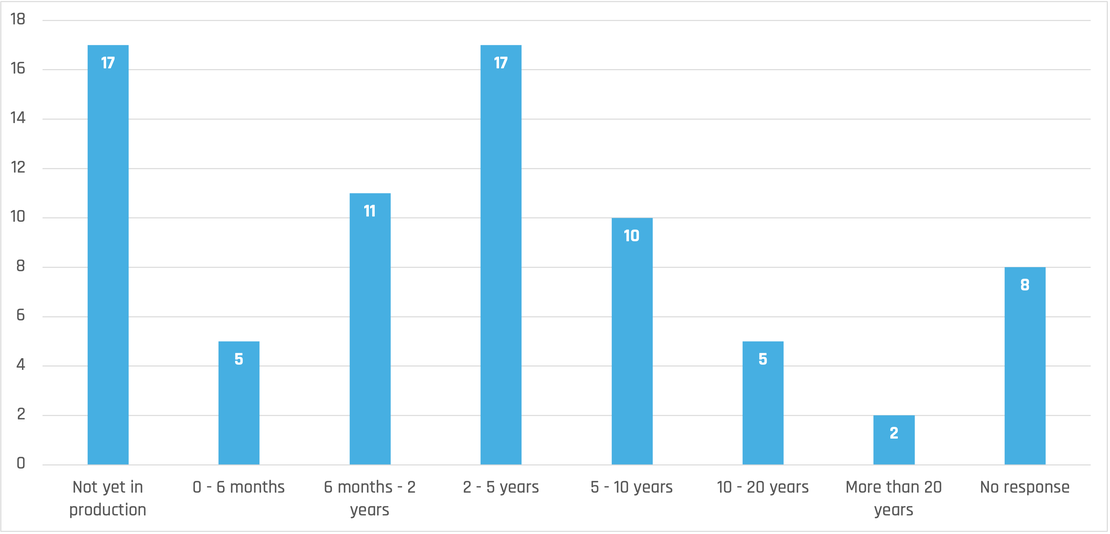
How long has the software been in production?
The systems examined in the reviews varied considerably in their level of maturity. Twelve were not yet in production or available on the market, indicating that the review was conducted early in their life cycle. At the other end of the spectrum, seven systems had been in operation for ten years or more.
Steps
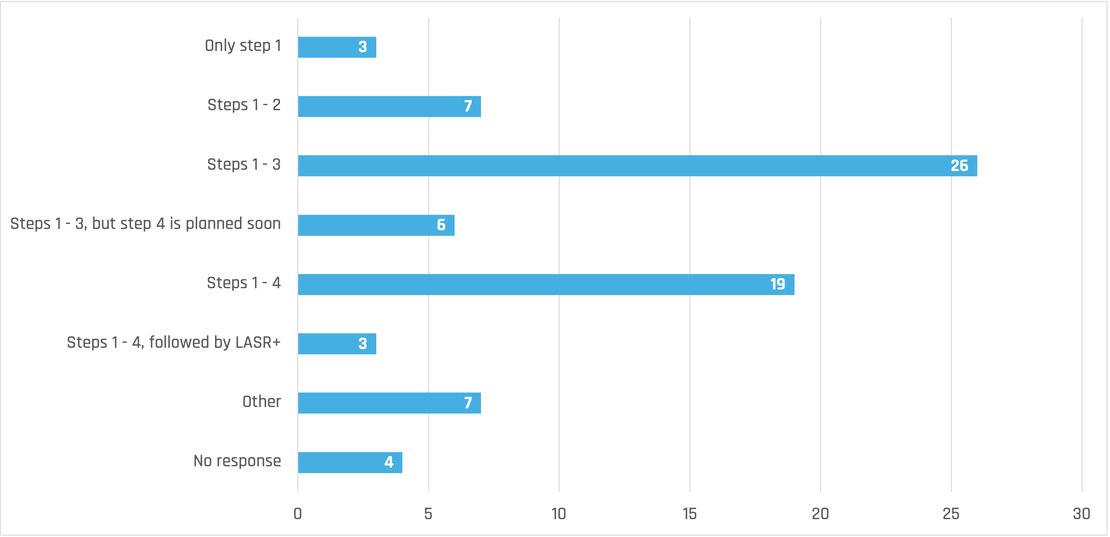
Which LASR steps did you carry out in your review?
LASR seems to be interruptible, as intended. Although almost all reviewers found the review results helpful and took action based on the results (see below), only a fourth of the respondents carried out all 4 steps of the LASR method. The most common exit seems to be after step 3 of the method, when reviewers have uncovered the first risks.
People
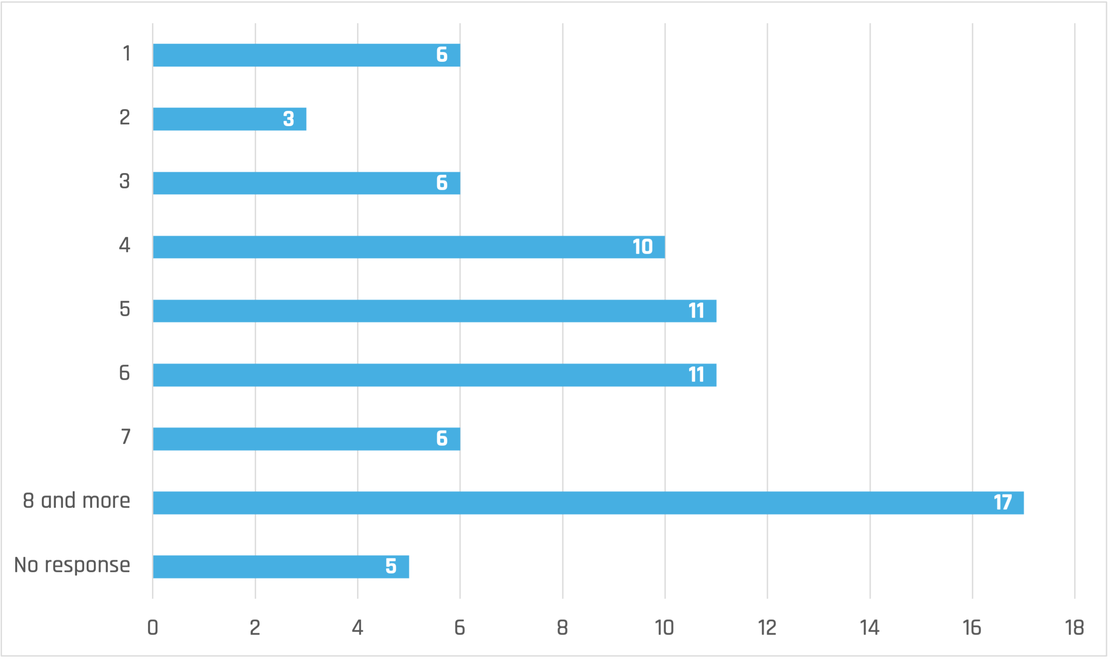
How many people were directly involved in carrying out the review?
Respondents were asked to report the number of individuals directly involved in the review, including those participating in individual steps. Stakeholders who only received the results were not to be counted. Response options in the survey ranged from 1 to ‘8 or more’; interviews indicated cases with up to 16 participants.
Duration
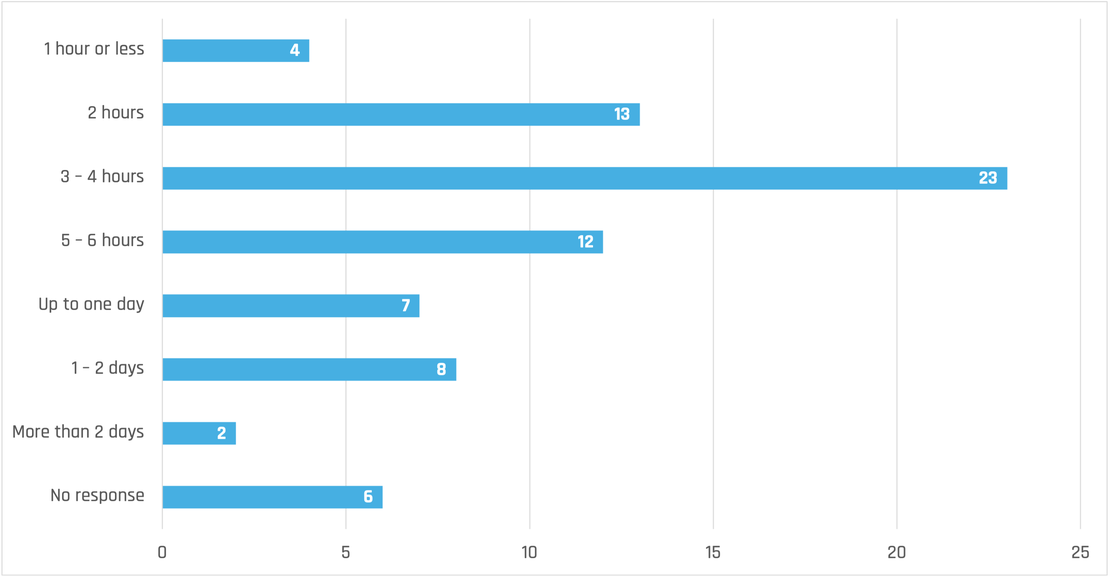
How much time did the review take?
LASR seems to be lightweight, as proposed. The median review in our dataset took 3-4 hours. When interpreting the data, we must consider, that many respondents were first-time reviewers. Also, some reviewing groups seem to be bigger than originally intended by the method. That is most probably why some respondents reported review durations of up to 2 days.
Outcome
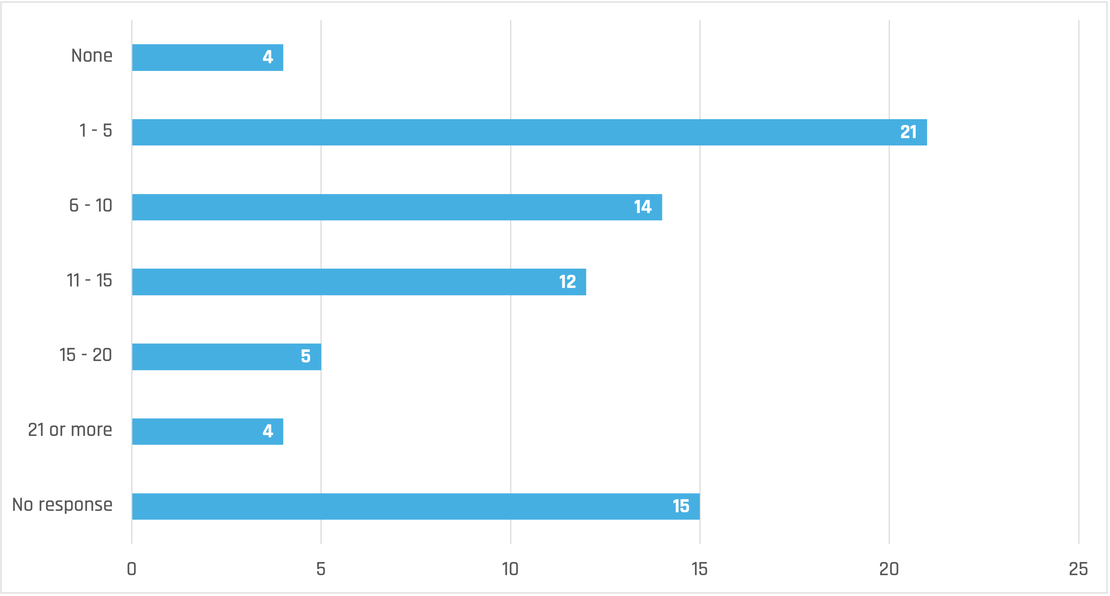
How many risks did you identify during LASR steps 3 and, if applicable, 4?
In step 3 of LASR, reviewers identify risks, uncovering an average of 9.10 when the review reached at least this stage. This result is, of course, based on our dataset.
Results Condensed

The data indicates a “sweet spot” at the 3-4 reviewers range. Groups of this size uncover the most risks per hour and are most efficient with the LASR approach, even when personnel costs of bigger reviewing groups are not taken into account.
After the Review
Did you and your team make further use of the review results afterwards?
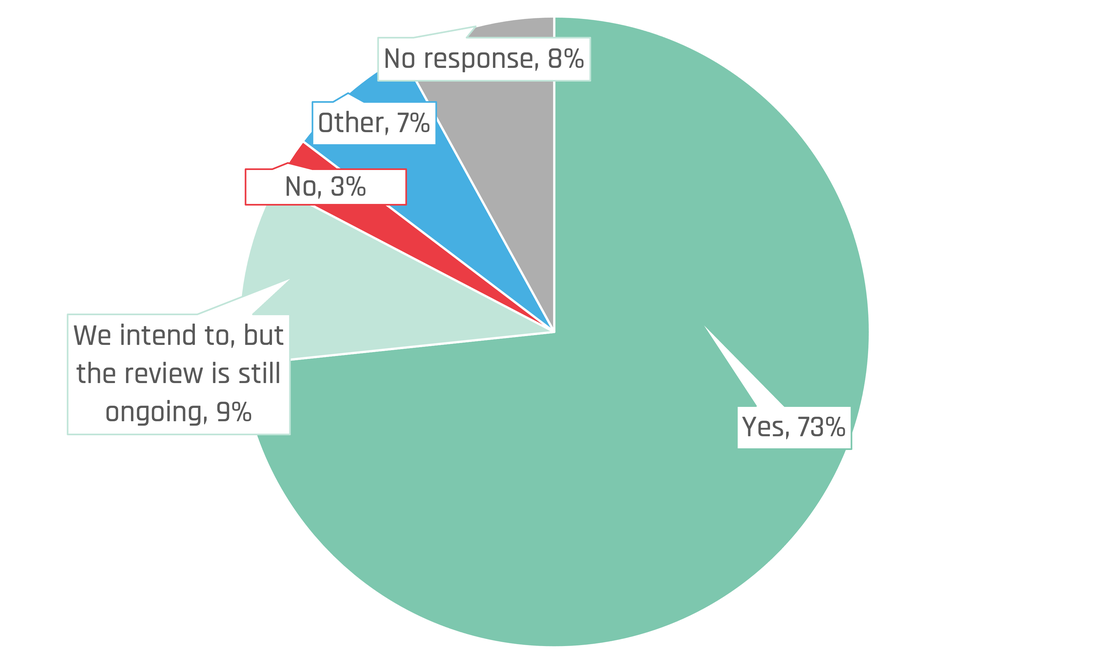
"We have planned measures to mitigate the main risks and scheduled them in the backlog."
A LASR User
Response in the Online Survey 2025